Easy Mapping of Geodata
We ran some more training sessions at ODI Leeds earlier this week, one of them being an introduction to the gathering, cleaning and visualisation of data. Just a couple of days before, I'd received an email inviting me to try the OpenDataSoft platform with course attendees, so that's exactly what we did!
The exercise we created involved the USGS Earthquake Hazards Program - one of my favourite examples of a geodata source. This site publishes near-live feeds aggregating the data from a worldwide network of seismometers, in a variety of formats, including XML, KML and GeoJSON. We focused on the latter, using the various summary feeds that summarise earthquake events of different magnitudes, over different time periods.
So what did we do with these datasets?
The first step was to create a free OpenDataSoft account. This gives you your own data portal, with its own domain name. The portal can host datasets, display them, export them in various formats, even provide API access.
With the portal up and running, the next step was to import one of the GeoJSON feeds. This is pretty straightforward. You can upload your dataset from a local file or provide a URL, such as that for one of the aforementioned GeoJSON feeds.
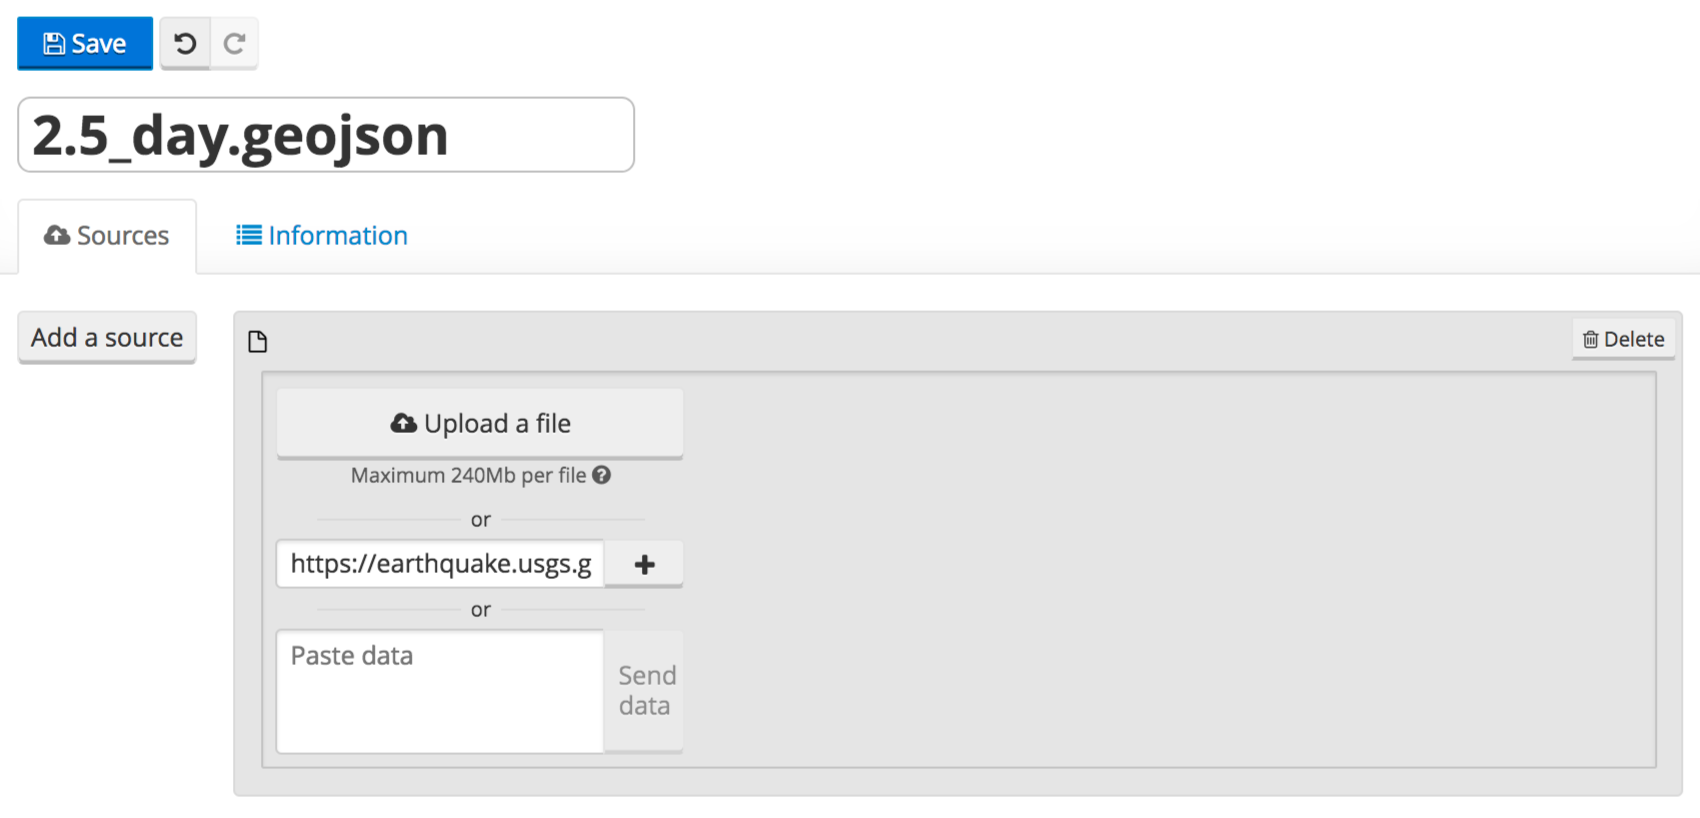
Adding a new dataset in OpenDataSoft
You get the opportunity to preview the uploaded data and to perform various kinds of processing on it before saving. Processors exist to geocode an address using the Google API, convert IP addresses to geocoordinates, convert between different coordinate reference systems, etc, etc. For our simple exercise none of these were needed, but it's useful to know that they are available for future projects.
The next steps are to configure the table and map views of the dataset. For the former, you can specify which fields of the dataset get displayed as columns in the table view; for the latter, you can specify which fields are displayed in a tooltip when you click on a map marker.

Configuring tooltips for the map
All you need to do now to make your dataset available via the portal is to click on the Save button and then on the Publish button.

Buttons to publish or unpublish a dataset
Clicking on Explore takes you to a page when you can view the data as a table or see it mapped. You can pan and zoom the map, and also filter the plotted points by drawing a circle, rectangle or polygon on the map.

Example of a published map
And that's all there is to it! All in all, I was impressed by OpenDataSoft's ease of use. I'll certainly be experimenting with it more in the future.
Comments
Comments powered by Disqus